Leaflet.jsをちょこっと試してみた。
OpenLayersネタばかりではなんなので、Leafletについてちょっと試してみました。
Leafletは、OpenLayersと同様browser上にmapを表現するJavaScript libraryです。
なんと言っても軽量です。めっちゃ容量が小さいのにはびっくりです。その代わりOpenLayersのように何でもてんこ盛りでなく、必要最低限の機能を持ち合わせています。
Leafletについては、leafletjs HPを参照してください。また、tutorialもあるので、実際に使うには問題ないと思います。
今回は、超~~簡単なLeafletのexampleを3つほど作成してみました。
OpenStreetmapを表示してみる。
まずは、OpenStreetMapをLeafletを使って表示してみましょう。
example codeは、以下のcodeを入力します。
保存先は、c:¥ms4w¥apache¥htdocs¥leaflet¥にしておきます。
ファイル名は、leaflet_example_01.htmlで保存します。
[html]
<!DOCTYPE html>
<html lang=’ja’>
<head>
<meta charset=’utf-8′ />
<title>leaflet example 01 OpenSterrtMap</title>
<link rel="stylesheet" href="http://cdn.leafletjs.com/leaflet-0.6.4/leaflet.css" />
<!–[if lte IE 8]>
<link rel="stylesheet" href="http://cdn.leafletjs.com/leaflet-0.6.4/leaflet.ie.css" />
<![endif]–>
<script src="http://cdn.leafletjs.com/leaflet-0.6.4/leaflet.js"></script>
<script type=’text/javascript’>
//leaflet OSM map
function init() {
// create a map in the "map_elemnt" div,
// set the view to a given place and zoom
var map = L.map(‘map_elemnt’);
map.setView([35.40, 139.50], 11);
// add an OpenStreetMap tile layer
var tileLayer = L.tileLayer(‘http://{s}.tile.osm.org/{z}/{x}/{y}.png’, {
attribution : ‘© <a href="http://osm.org/copyright">OpenStreetMap</a> contributors’
});
tileLayer.addTo(map);
// add a marker in the given location,
// attach some popup content to it and open the popup
var mapMarker = L.marker([35.40, 139.50]);
mapMarker.addTo(map);
mapMarker.bindPopup(‘CSS3 popup. <br> ここはどこでしょうか?’);
mapMarker.openPopup();
// add layers
var baseLayers = {
"OpenStreetMap": tileLayer
};
var overlays = {
"Marker": mapMarker,
};
L.control.layers(baseLayers, overlays).addTo(map);
// add control scale
L.control.scale().addTo(map);
}
</script>
</head>
<body onload=’init();’>
<div id=’map_elemnt’ style=’width: 500px; height: 500px; border: solid 1px #999;’></div>
</body>
</html>
[/html]
Leafletのobjectを使う場合、必ずLとなります。
ここでOpenLayersと違うのは、tileの呼び出しは自前で作成する必要があります。
それは、
var tileLayer = L.tileLayer('http://{s}.tile.osm.org/{z}/{x}/{y}.png', { attribution : '© <a href="http://osm.org/copyright">OpenStreetMap</a> contributors' });
の部分になります。
そして、経度緯度の記述が(緯度、経度)となり、
var map = L.map('map_elemnt');
map.setView([35.40, 139.50], 11);
のようにOpenLayersとは逆になります。 これは注意点ですね。
後は、LeafletのAPIなどをみれば難しいcodeではありません。
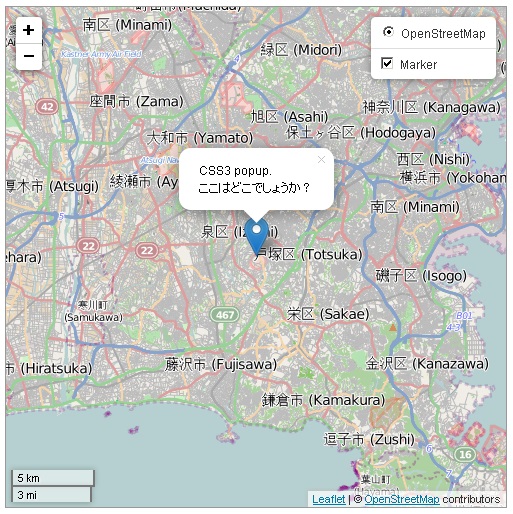
保存後、FireFoxを立ち上げて、http://localhost/leaflet/leaflet_example_01.htmlと入力すると、

ようにOpenStreetMapが表示されます。
基盤地図情報25000を表示してみる。
[html]
<!DOCTYPE html>
<html lang=’ja’>
<head>
<meta charset=’utf-8′ />
<title>leaflet example 02 基盤地図情報</title>
<link rel="stylesheet" href="http://cdn.leafletjs.com/leaflet-0.6.4/leaflet.css" />
<!–[if lte IE 8]>
<link rel="stylesheet" href="http://cdn.leafletjs.com/leaflet-0.6.4/leaflet.ie.css" />
<![endif]–>
<script src="http://cdn.leafletjs.com/leaflet-0.6.4/leaflet.js"></script>
<script type=’text/javascript’>
//leaflet example 02 基盤地図情報
function init() {
var map = L.map("map_elemnt").setView([35.40, 139.50], 10);
var mainLayer = L.tileLayer("http://www.finds.jp/ws/tmc/1.0.0/KBN25000ANF-900913-L/{z}/{x}/{y}.png", {
	attribution : "<a target="_blank" href="http://www.finds.jp/wsdocs/kibanwms/index.html.ja">基盤地図情報(平24情使、第794号)</a>",
	maxZoom : 18
}).addTo(map);
var nameLayer = L.tileLayer("http://www.finds.jp/ws/tmc/1.0.0/pntms-900913-L/{z}/{x}/{y}.png", {
	attribution : "<a target="_blank" href="http://www.finds.jp/wsdocs/pnwms/index.html.ja">地名WMS</a>",
	maxZoom : 18
}).addTo(map);
var mapMarker = L.marker([35.40, 139.50]);
mapMarker.addTo(map);
// add layers
var baseLayers = {
"基本地図情報": mainLayer
};
var overlays = {
"地名": nameLayer,
"Marker": mapMarker,
};
L.control.layers(baseLayers, overlays).addTo(map);
// add control scale
L.control.scale().addTo(map);
};
</script>
</head>
<body onload="init()">
<div id=’map_elemnt’ style=’width: 500px; height: 500px; border: solid 1px #999;’></div>
</body>
</html>
[/html]
Leafletのobjectを使う場合、必ずLとなります。
ここでOpenLayersと違うのは、tileの呼び出しは自前で作成する必要があります。
それは、
var mainLayer = L.tileLayer("http://www.finds.jp/ws/tmc/1.0.0/KBN25000ANF-900913-L/{z}/{x}/{y}.png", { attribution : "<a target="_blank" href="http://www.finds.jp/wsdocs/kibanwms/index.html.ja">基盤地図情報(平24情使、第794号)</a>", maxZoom : 18 }).addTo(map); var nameLayer = L.tileLayer("http://www.finds.jp/ws/tmc/1.0.0/pntms-900913-L/{z}/{x}/{y}.png", { attribution : "<a target="_blank" href="http://www.finds.jp/wsdocs/pnwms/index.html.ja">地名WMS</a>", maxZoom : 18 }).addTo(map);
の部分になります。ここでは、基盤地図情報と地名のtileを使います。
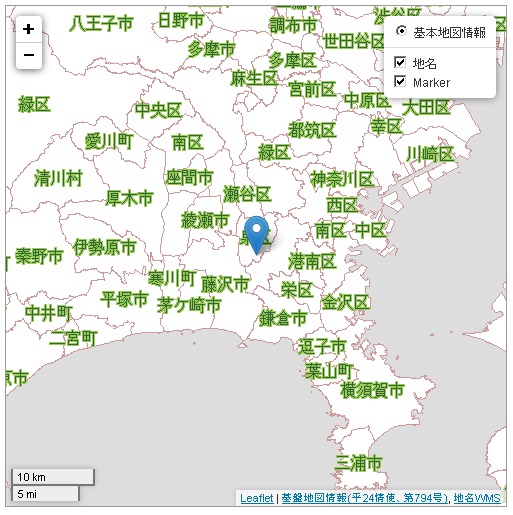
保存後、FireFoxを立ち上げて、http://localhost/leaflet/leaflet_example_02.htmlと入力すると、

ように基盤地図情報が表示されます。
電子国土を表示してみる
次に、国土地理院が提供している電子国土をLeafletを使って表示してみましょう。
電子国土タイルにタイル仕様が書かれていますので、一度目を通してください。
codeは、Leafletで電子国土タイルを使う場合のシンプルサンプルを参考にしました。
先人に感謝です。
example codeは、以下のcodeを入力します。
保存先は、c:¥ms4w¥apache¥htdocs¥leaflet¥にしておきます。
ファイル名は、leaflet_example_03.htmlで保存します。
[html]
<!DOCTYPE html>
<html lang=’ja’>
<head>
<meta charset=’utf-8′ />
<title>leaflet example 03 電子国土</title>
<link rel="stylesheet" href="http://cdn.leafletjs.com/leaflet-0.6.4/leaflet.css" />
<!–[if lte IE 8]>
<link rel="stylesheet" href="http://cdn.leafletjs.com/leaflet-0.6.4/leaflet.ie.css" />
<![endif]–>
<script src="http://cdn.leafletjs.com/leaflet-0.6.4/leaflet.js"></script>
<script type=’text/javascript’>
//Digital Japan Leaflet
function init() {
map = L.map(map).setView([35.40, 139.50], 10);
map.attributionControl.setPrefix(‘a map by CTKK’);
layers = [null, null, null, null, null,
['http://cyberjapandata.gsi.go.jp/sqras/all/JAIS/latest/', '.png'], // 5
['http://cyberjapandata.gsi.go.jp/sqras/all/JAIS/latest/', '.png'], // 6
['http://cyberjapandata.gsi.go.jp/sqras/all/JAIS/latest/', '.png'], // 7
['http://cyberjapandata.gsi.go.jp/sqras/all/JAIS/latest/', '.png'], // 8
['http://cyberjapandata.gsi.go.jp/sqras/all/BAFD1000K/latest/', '.png'], // 9
['http://cyberjapandata.gsi.go.jp/sqras/all/BAFD1000K/latest/', '.png'], // 10
['http://cyberjapandata.gsi.go.jp/sqras/all/BAFD1000K/latest/', '.png'], // 11
['http://cyberjapandata.gsi.go.jp/sqras/all/BAFD200K/latest/', '.png'], // 12
['http://cyberjapandata.gsi.go.jp/sqras/all/BAFD200K/latest/', '.png'], // 13
['http://cyberjapandata.gsi.go.jp/sqras/all/BAFD200K/latest/', '.png'], // 14
['http://cyberjapandata.gsi.go.jp/sqras/all/DJBMM/latest/', '.png'], // 15
['http://cyberjapandata.gsi.go.jp/sqras/all/DJBMM/latest/', '.png'], // 16
['http://cyberjapandata.gsi.go.jp/sqras/all/DJBMM/latest/', '.png'], // 17
['http://cyberjapandata.gsi.go.jp/sqras/all/FGD/latest/', '.png'] // 18
];
var layer = L.tileLayer(‘nil’, {
tileSize : 256,
minZoom : 5,
maxZoom : 18,
attribution : ‘電子国土’
});
layer.getTileUrl = function(coord) {
var tid = (’0000000′ + coord.x).slice(-7) + (’0000000′ + coord.y).slice(-7);
return layers[coord.z][0] + coord.z + ‘/’
+ tid.charAt(0) + tid.charAt(7) + ‘/’
+ tid.charAt(1) + tid.charAt(8) + ‘/’
+ tid.charAt(2) + tid.charAt(9) + ‘/’
+ tid.charAt(3) + tid.charAt(10) + ‘/’
+ tid.charAt(4) + tid.charAt(11) + ‘/’
+ tid.charAt(5) + tid.charAt(12) + ‘/’
+ tid + layers[coord.z][1];
}
map.addLayer(layer);
var mapMarker = L.marker([35.40, 139.50]);
mapMarker.addTo(map);
// add layers
var baseLayers = {
"電子国土": layer
};
var overlays = {
"Marker": mapMarker,
};
L.control.layers(baseLayers, overlays).addTo(map);
// add control scale
L.control.scale().addTo(map);
}
</script>
</head>
<body onload="init()">
<div id=’map’ style=’width: 500px; height: 500px;’></div>
</body>
</html>
[/html]
Leafletのobjectを使う場合、必ずLとなります。
ここでOpenLayersと違うのは、tileの呼び出しは自前で作成する必要があります。
そして、layer.getTileUrlで呼び出すタイルのURLを作成しています。
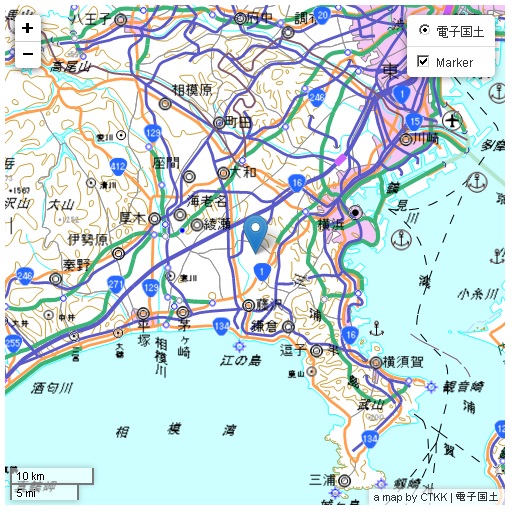
保存後、FireFoxを立ち上げて、http://localhost/leaflet/leaflet_example_03.htmlと入力すると、

ように基盤地図情報が表示されます。
jsfiddleにOpenStreetMap Leaflet exampleを参考に載せておきます。controlを増やしたり、いろいろとOptionsを付け加えたりしてください。
今回のまとめ
Leaflet.jsについて基本中の基本について試してみました。jsfiddleにOpenStreetMap Leaflet exampleを使って見て、いろいろとテストしてみてください。
OpenLayersに比べて軽量かどうかは、今回のexampleでは判断できせんが、GeoJSONなども読み込むことができるので、また試してみましょう。
また、本blogは、htmlやCSSやJavaScriptの基本的なことはある程度理解している前提で話を進めています。また、誤字、脱字、spell間違いや勘違いも多々出てくると考えられます。
それは違うじゃん!!とかいろんな意見をいただければと思います。
そこんところ ヨロシク~~!!

最近のコメント