PythonでGeoSpatial Dataの読み書きについて_1[Chapter 8]
PythonでGeoSpatial dataについて[Chapter 7] に引き続き、Pythonで本格的にGeoSpatial data(vector & raster)の読み書きの基本を学んでおきます。
本tutorialは、Python Geospatial Developmentを参考にして、実践的に使えるPythonでGeoSpatialの使い方を学んでいくものです。
また、本Blog中のsource code等に関しては、あくまでも参考としてください。なにがあっても責任とれませんので。
そこんところ、ヨロシク~~!!
準備
PythonでGeoSpatialをやってみる。[Chapter 1] でPythonとGeoSpatialに関するlibraryが設定できているもとして進めていきます。
また、下記のwindows版のlibraryがinstallしてください。
-
GDAL/OGR version 1.7 or later http://gdal.org
-
pyproj version 1.8.6 or later http://code.google.com/p/pyproj
-
Shapely version 1.2 or later http://trac.gispython.org/lab/wiki/Shapely
このtutorialでは、pyprojについては、PythonでProjectionを使ってみる。[Chapter 4] 、Shapelyについてはは、PythonでGeoSpatial dataの解析と操作について[Chapter 5] を参考にしてください。
Reading and Writeing GeoSpatial data
まずは、vector dataとしてShapefileを読み込んで、ちょっとした解析をやってみます。
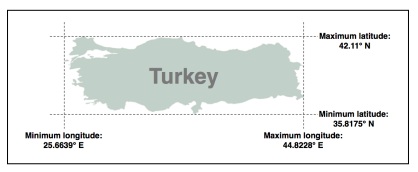
世界の国のbounding boxを計算
世界の各国の最大最小の緯度/経度値「bounding box」を取得してみましょう。
この「bounding box」は特別の国の地図を作成するのに使用することができます。
例えば、トルコの「bounding box」はこのように見えるでしょう:
sample data
sample dataのTM_WORLD_BORDERS-0.3からView raw fileをclickしてdownload、その後解凍しておきます。
私の開発環境では、f:¥shapefile_dataのfolderを作成して、解凍したfileをcopyしておきます。
bounding box code
vector dataを扱うので、ogrを使います。
Ediorで下記のcodeを入力して、保存します。
保存先はf:¥python_example¥chapter_5¥ folderにcalcBoundingBoxes.pyで保存します。
[python]
import osgeo.ogr
shapefile = osgeo.ogr.Open("f:¥¥shapefile_data¥¥TM_WORLD_BORDERS-0.3.shp")
layer = shapefile.GetLayer(0)
countries = [] # List of (code,name,minLat,maxLat,
               # minLong,maxLong tuples.
for i in range(layer.GetFeatureCount()):
    feature = layer.GetFeature(i)
    countryCode = feature.GetField("ISO3")
    countryName = feature.GetField("NAME")
    geometry = feature.GetGeometryRef()
    minLong,maxLong,minLat,maxLat = geometry.GetEnvelope()

    countries.append((countryName, countryCode,
                      minLat, maxLat, minLong, maxLong))
countries.sort()
for name,code,minLat,maxLat,minLong,maxLong in countries:
    print "%s (%s) lat=%0.4f..%0.4f, long=%0.4f..%0.4f" ¥
        % (name, code, minLat, maxLat, minLong, maxLong)
[/python]
注意)上記codeで¥は全角ですので、半角にするかもしくは、バックスラッシュに置き換えてください。
codeの説明
calcBoundingBoxes.pyが何を行っているのかを順にみていきましょう。
1.osgeo.ogrlibrary 読み込み
import osgeo.ogr
2.ShapefileのOpenとLayerの定義
shapefile = osgeo.ogr.Open("f:¥¥shapefile_data¥¥TM_WORLD_BORDERS-0.3.shp") layer = shapefile.GetLayer(0)
Shapefileのlayerはただ一つのlayerですから、GetLayer(0)となります。
3.countriesのlistの定義
countries = [] # List of (code,name,minLat,maxLat, # minLong,maxLong tuples.
Shapefileとbounding boxの値を入れるためのlistです。
4.countriesのbounding boxの計算
for i in range(layer.GetFeatureCount()): feature = layer.GetFeature(i) countryCode = feature.GetField("ISO3") countryName = feature.GetField("NAME") geometry = feature.GetGeometryRef() minLong,maxLong,minLat,maxLat = geometry.GetEnvelope() countries.append((countryName, countryCode, minLat, maxLat, minLong, maxLong))
layer.GetFeatureCount()でデータ数分for文でloopします。ここでは国の数になります。
featureはここでは各国となります。Shapefileはfeatureの集合と考えると良いでしょう。
GetFieldで属性値を取り出します。ここでは、countryCodeとcountryNameを取り出しています。
feature.GetGeometryRef()でgeometryを取得して、 geometry.GetEnvelope()で最大最小の経度緯度を取り出します。
取り出した最大最小の経度緯度をcountriesのlistに追加していきます。
5.countrieの昇順sort
countries.sort()
6.bounding boxの出力
for name,code,minLat,maxLat,minLong,maxLong in countries: print "%s (%s) lat=%0.4f..%0.4f, long=%0.4f..%0.4f" ¥ % (name, code, minLat, maxLat, minLong, maxLong)
bounding boxの国別の値を出力する。
今回のまとめ
今回は、PythonでのGeoSpatial dataを読み込んで「bounding box」を取得してみました。
次回は、このexample codeを使って、「bounding box」からShapefileを作成してみます。
また、本tutorialは、Python Scriptの基本的なことはある程度理解している前提で今後も話を進めていきます。また、誤字、脱字、spell間違いや勘違いや翻訳間違いなど多々出てくると考えられます。
それは違うじゃん!!とかいろんな意見をいただければと思います。
そこんところ ヨロシク~~!!


最近のコメント