GeoExt1.1を使ってみる。[Chapter 4]
今回は、GeoExtのLayerを簡単なtree表示をやってみます。
basemapとして表示する地図は、OpenStreetMapを使ってみます。
BaseLayerに電子国土も追加することができます。
セットアップと入手については、GeoExt1.1 [Chapter 1] を参考にしてください。
今回使うgridpanelについては、Ext.tree.TreePanelクラスが参考になります。
まずは、layoutの確認
mapやgridやtree node などいろいろと付け加えていくと、ExtJsのpanelがどんな形になっていくのかわからなくなってきます。
そこで、必要最低限のWindowとpanelのおさらいをしておきます。
詳しくは、ExtJS入門6 Ext.Panelクラスについてなどが参考になります。
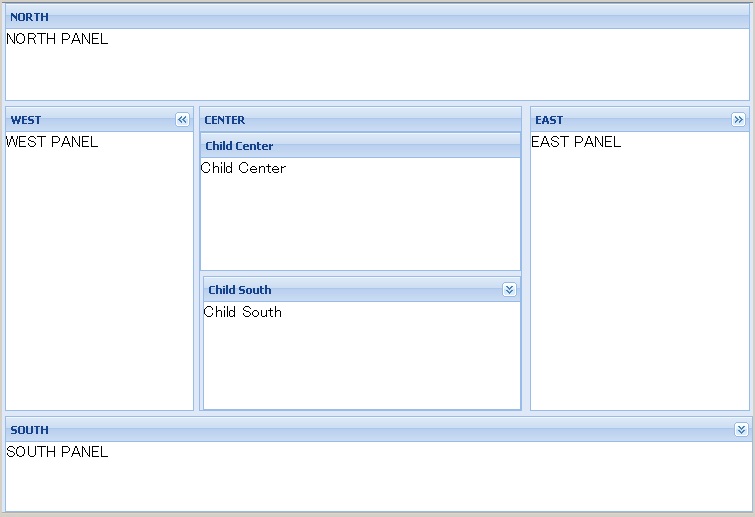
な感じで、layoutを考えてみます。
この例では、viewportの設定になります。
layout_sample.htmlは、
<!DOCTYPE html>
<html lang="ja" >
<head>
<meta http-equiv="Content-Type" content="text/html; charset=utf-8" />
<title>Viewport Sample</title>
<!--Ext JS CSS-->
<link rel="stylesheet" href="../resources/css/ext-all.css" type="text/css" />
<!--ext js-->
<script type="text/javascript" src="../adapter/ext/ext-base.js"></script>
<script type="text/javascript" src="../ext-all.js"></script>
<!--自分のjs-->
<script type="text/javascript" src="layout_sample.js"></script>

</head>
<body>
<div class="body">
</div>
</body>
</html>
で、各自ExtJSの場所は、各自の環境に変更してください。
JavaScript「layout_sample.js」は、
Ext.onReady(function() {

var northPanel = new Ext.Panel({
title : 'NORTH',
html : 'NORTH PANEL',
margins : '0 3 0 3',
region : 'north',
split : true
});
var eastPanel = new Ext.Panel({
title : 'EAST',
html : 'EAST PANEL',
margins : '0 3 0 3',
region : 'east',
collapsible : true,
split : true
});

var westPanel = new Ext.Panel({
title : 'WEST',
html : 'WEST PANEL',
margins : '0 0 0 3',
region : 'west',
collapsible : true,
split : true
});

var southPanel = new Ext.Panel({
title : 'SOUTH',
html : 'SOUTH PANEL',
margins : '0 0 0 3',
region : 'south',
collapsible : true,
split : true
});

var childCenterPanel = {
title : 'Child Center',
html : 'Child Center',
margins : '0 0 0 0',
region : 'center'
};

var childsouthPanel = {
title : 'Child South',
html : 'Child South',
margins : '0 0 0 3',
collapsible : true,
split : true,
region : 'south'
};

var centerPanel = new Ext.Panel({
title : 'CENTER',
width : '100px',
region : 'center',
layout : 'border',
items : [childCenterPanel, childsouthPanel]
});

new Ext.Viewport({
layout : 'border',
items : [centerPanel, northPanel, eastPanel, westPanel, southPanel]
});

});
Ext.onReady(function() {

var northPanel = new Ext.Panel({
title : 'NORTH',
html : 'NORTH PANEL',
margins : '0 3 0 3',
region : 'north',
split : true
});
var eastPanel = new Ext.Panel({
title : 'EAST',
html : 'EAST PANEL',
margins : '0 3 0 3',
region : 'east',
collapsible : true,
split : true
});

var westPanel = new Ext.Panel({
title : 'WEST',
html : 'WEST PANEL',
margins : '0 0 0 3',
region : 'west',
collapsible : true,
split : true
});

var southPanel = new Ext.Panel({
title : 'SOUTH',
html : 'SOUTH PANEL',
margins : '0 0 0 3',
region : 'south',
collapsible : true,
split : true
});

var childCenterPanel = {
title : 'Child Center',
html : 'Child Center',
margins : '0 0 0 0',
region : 'center'
};

var childsouthPanel = {
title : 'Child South',
html : 'Child South',
margins : '0 0 0 3',
collapsible : true,
split : true,
region : 'south'
};

var centerPanel = new Ext.Panel({
title : 'CENTER',
width : '100px',
region : 'center',
layout : 'border',
items : [childCenterPanel, childsouthPanel]
});

new Ext.Viewport({
layout : 'border',
items : [centerPanel, northPanel, eastPanel, westPanel, southPanel]
});

});
基本的には、center,north,west,east,southの5区分されます。
今回は、centerを入れ子状態にして、child center, child southと2区分しています。
要するに、panel objectを作成して、最終的に表示するviewportにitemsに与えていることになります。
注意事項としては、centerがなければerrorになります。
ごちゃごちゃ書いているとわかりませんが、簡素化するとわかるかと思います。
では、このlayoutを元にtree nodeを付け加えてみましょう。
tree nodeの表示
tree nodeはtreePanelを使って作成します。
var treePanel = new Ext.tree.TreePanel({
	title : 'Layer tree',
	region : 'west',
	split : true,
	width : 200,
	collapsible : true,
	margins : '3 0 3 3',
	cmargins : '3 3 3 3',
	root : new GeoExt.tree.LayerContainer({
		layerStore : mapPanel.layers,
		expanded : true
	})
});
mapPanelは表示するmapのobjectになります。
これは、GeoExtのobjectになり、
var mapPanel = new GeoExt.MapPanel({
	title : "CENTER",
	region : "center",
	height : 250,
	width : 600,
	map : map,
	zoom : 9
});
で定義しています。
このmapにOpenStreetMap、電子国土やGeoJSONデータが含まれています。
layout0.jsのコードは、
Ext.onReady(function() {

var map = null;

// 座標系の設定
var epsg4326 = new OpenLayers.Projection("EPSG:4326");
var epsg3857 = new OpenLayers.Projection("EPSG:3857");

var map = new OpenLayers.Map();

// openstreetmapの作成
var osmLayer = new OpenLayers.Layer.OSM("OpenStreetMap");

// 電子国土の作成
var webtisLayer = new webtis.Layer.BaseMap("電子国土");

map.displayProjection = epsg4326;

// controlの設定
// map.addControl(new OpenLayers.Control.LayerSwitcher());
map.addControl(new OpenLayers.Control.MousePosition());
map.addControl(new OpenLayers.Control.(|>));

// create vector layer
var context = {
getColor : function(feature) {
var index;
if (feature.attributes.name.indexOf("横浜") > -1) {
return 'green';
} else if (feature.attributes.name.indexOf("川崎") > -1) {
return 'orange';
} else if (feature.attributes.name.indexOf("相模原") > -1) {
return 'yellow';
} else {
return 'red';
}
}
};

// polygon template
var template = {
fillOpacity : 0.5,
fillColor : "${getColor}",
strokeWidth : 1,
strokeOpacity : 1,
strokeColor : "${getColor}"
};

var style = new OpenLayers.Style(template, {
context : context
});

// 神奈川県の市区町村行政界
var prefLayer = new OpenLayers.Layer.Vector("行政界", {
strategies : [new OpenLayers.Strategy.Fixed()],
styleMap : new OpenLayers.StyleMap({
'default' : style
}),
protocol : new OpenLayers.Protocol.HTTP({
url : "../data/c14_region.json",
format : new OpenLayers.Format.GeoJSON()
})
});

// 神奈川県の主要道路
var roadLayer = new OpenLayers.Layer.Vector("主要道路", {
strategies : [new OpenLayers.Strategy.Fixed()],
protocol : new OpenLayers.Protocol.HTTP({
url : "../data/c14_road.json",
format : new OpenLayers.Format.GeoJSON()
})
});

// layerの追加
map.addLayers([osmLayer, webtisLayer, prefLayer, roadLayer]);

map.setCenter(new OpenLayers.LonLat(139.4, 35.4).transform(epsg4326,
epsg3857), 9);

// create map panel
var mapPanel = new GeoExt.MapPanel({
title : "CENTER",
region : "center",
height : 250,
width : 600,
map : map,
zoom : 9
});

var treePanel = new Ext.tree.TreePanel({
title : 'Layer tree',
region : 'west',
split : true,
width : 200,
collapsible : true,
margins : '3 0 3 3',
cmargins : '3 3 3 3',
// width: 145,
// height: 300,
// renderTo: "tree",
root : new GeoExt.tree.LayerContainer({
layerStore : mapPanel.layers,
expanded : true
})
});

var centerPanel = new Ext.Panel({
title : 'Map OpenStreetMapとGeoJSONデータ',
region : 'center',
layout : 'border',
//items : [mapPanel, gridPanel]
items : [mapPanel]
});

var win = new Ext.Window({
title : 'Map Layout Window',
closable : true,
width : 800,
height : 600,
// border:false,
plain : true,
layout : 'border',
items : [treePanel, centerPanel]
});

win.show();

});
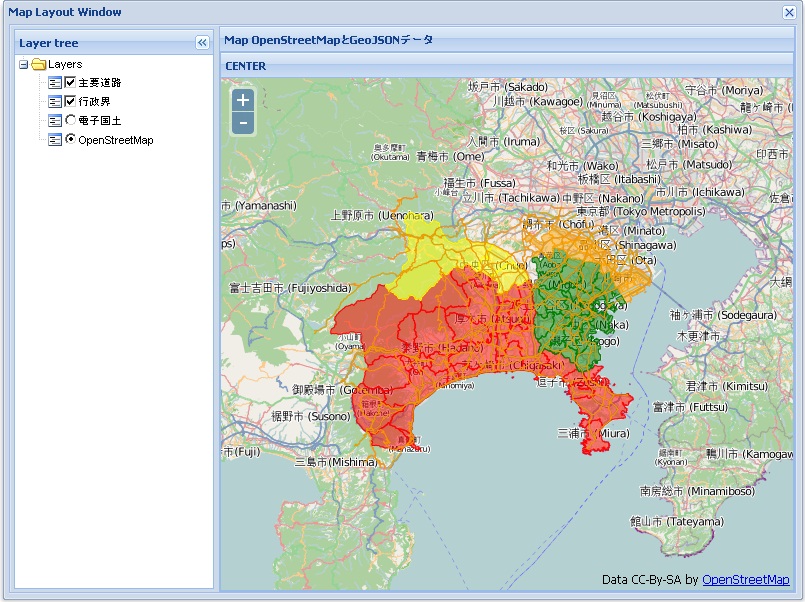
機能的には、
-
mapの作成
-
神奈川県の行政界と主要道路GeoJSONデータ読み込み
-
treePanelの作成
-
mapに表示
-
mousepositionの緯度経度を度分秒で表示
-
EPSG:4326に統一
Ext.onReady(function(){….}はExtJSのお約束です。
このExtJSについては、各人でお勉強しといてくださいね。
な感じです。
basemapはoption buttonとなり、overlay可能なlayerはcheckboxになっています。
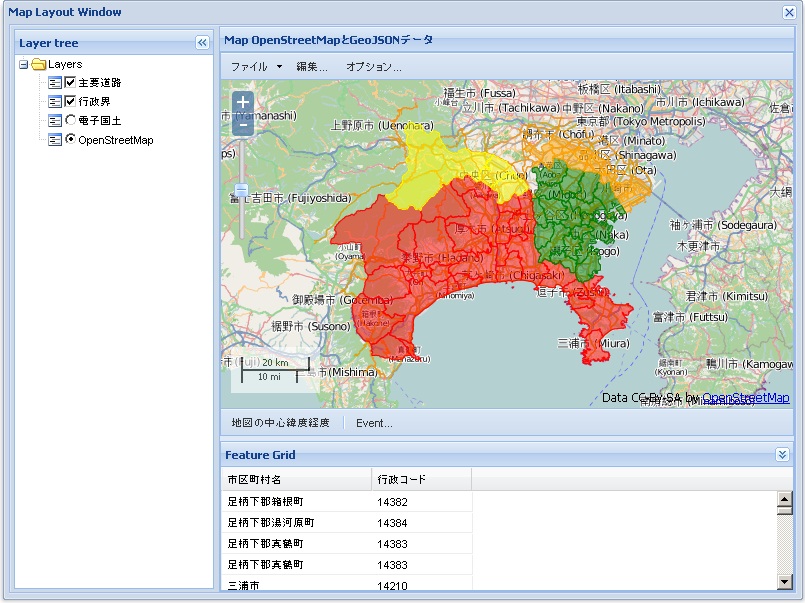
また、 Chapter 3 のgridやzoomsliderなtoolbarを付け加えてみると、

な感じ、WEB GISっぽいですね。
tree layoutサンプルをクリックすると今回の地図が表示されます。
OverviewMapのiconがなぜか表示されません。
mouseをicon近くに持って行くとmouse cursorが変わるので、クリックすると表示されます。
なぜだろう?
この現象は、OpenLayers-2.11では、iconのlink先がおかしいのか「四角い枠」だけ表示されます。
今回のまとめ
layoutの確認とtreePanelの表示してみました。
これを使えば、いろいろなデータを重ね合わせて、また、gridの属性値を表示するとができます。
また、属性値などを別windowに表示したり、グラフ化したりもできますよね。
次回は、vector dataのfeature popupをtryしてみます。


Comments are closed.