GeoExt1.1を使ってみる。[Chapter 3]
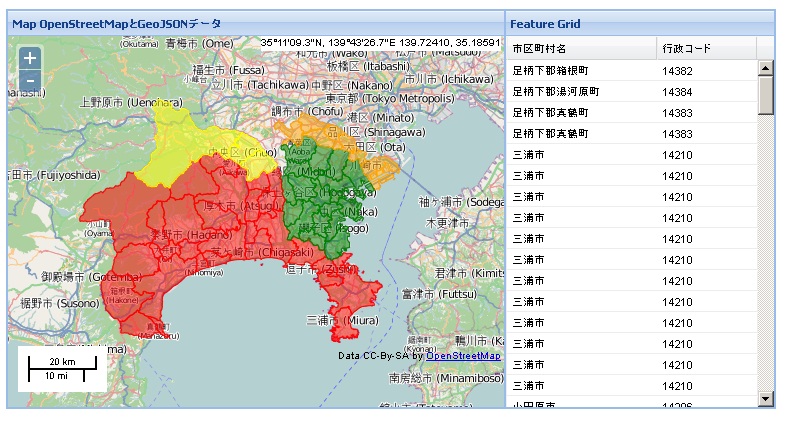
GeoExtのLayerのtree表示を行う前に、gridpanelに属性値を表示する方法をやってみます。
Extjsのgridpanelについては、Ext.grid.GridPanelクラスなどをみてください。
ようするに、テーブルを表示するイメージでしょうか?
表示する地図は、OpenStreetMapを使ってみます。
BaseLayerに電子国土も追加することができます。
セットアップと入手については、GeoExt1.1 [Chapter 1] を参考にしてください。
今回使うgridpanelについては、ExtJS入門17 グリッド・パネル 基本編が大変参考になります。
OpenStreetmapとGridの表示
まずは、Grid with featuresのサンプルを参考にして、mapとgridの連携を行います。
htmlとjsに分けて記述していきます。
まずは、htmlファイルです。
ファイ名は、feature-grid.html
<!DOCTYPE HTML>
<html lang="ja">
<head>
<meta http-equiv="content-type" content="text/html;charset=utf-8">
<title>GeoExt FeatureStore in an Ext Grid</title>

<script type="text/javascript" src="../ext-3.4.1/adapter/ext/ext-base.js"></script>
<script type="text/javascript" src="../ext-3.4.1/ext-all.js"></script>
<link rel="stylesheet" type="text/css" href="../ext-3.4.1/resources/css/ext-all.css" />
<link rel="stylesheet" type="text/css" href="../ext-3.4.1/examples/shared/examples.css" />
<script src="../OpenLayers/OpenLayers.js"></script>
<script type="text/javascript" src="../GeoExt/script/GeoExt.js"></script>

<script type="text/javascript" src="feature-grid.js"></script>

<style type="text/css">
.olControlMousePosition {
background-color: white;
font-size: 12pt;
height: 15px;
position: absolute;
right: 10px;
top: 0;
}
.olControlScaleLine {
background: white;
padding: 10px;
}
</style>
</head>
<body>
<h1>Grid Panel configured with a GeoExt.data.FeatureStore</h1>

<p>
This example shows an Ext grid loaded with features read from a
GeoJSON document (../data/c14_region.json).
</p>

<p>
Because the layer and the store are bound to each other, the
features loaded into the store are automatically added to the layer. <br>
A GeoExt feature selection model is also used so that selecting rows in
the grid selects features in the layer, and vice-versa.
</p>

<p>
See <a href=feature-grid.js>feature-grid.js</a>.
</p>

<div id="mainpanel"></div>
</body>
</html>
mousepositionとscalelineについて、cssを付け加えています。
次に、feature-grid.js
機能的には、
-
mapの作成
-
神奈川県のGeoJSONデータ読み込み
-
gridに表示
-
mapに表示
-
mousepositionの緯度経度を度分秒で表示
-
EPSG:4326に統一
girdの作成は
-
dataの用意(GeoJSON形式)今回は神奈川県の行政界を使います。
-
storeの作成(datastore)
-
gridの定義
-
gridの表示
となります。
var mapPanel, datastore, gridPanel, mainPanel;

Ext.onReady(function() {

// 座標系の設定
var epsg4326 = new OpenLayers.Projection("EPSG:4326");
var epsg3857 = new OpenLayers.Projection("EPSG:3857");

var map = new OpenLayers.Map();

// openstreetmapの作成
var osmLayer = new OpenLayers.Layer.OSM("OSM");

map.displayProjection = epsg4326;

// controlの設定
map.addControl(new OpenLayers.Control.MousePosition({
id : "ll_mouse",
formatOutput : formatLonlats
}));
map.addControl(new OpenLayers.Control.ScaleLine());

map.addControl(new OpenLayers.Control.LayerSwitcher());
map.addControl(new OpenLayers.Control.MousePosition());
map.addControl(new OpenLayers.Control.OverviewMap());

// create vector layer
var context = {
getColor : function(feature) {
var index;
if (feature.attributes.name.indexOf("横浜") > -1) {
return 'green';
} else if (feature.attributes.name.indexOf("川崎") > -1) {
return 'orange';
} else if (feature.attributes.name.indexOf("相模原") > -1) {
return 'yellow';
} else {
return 'red';
}
}
};

// polygon template
var template = {
fillOpacity : 0.5,
fillColor : "${getColor}",
strokeWidth : 1,
strokeOpacity : 1,
strokeColor : "${getColor}"
};

var style = new OpenLayers.Style(template, {
context : context
});

// 神奈川県の市区町村行政界
var vecLayer = new OpenLayers.Layer.Vector("行政界", {
strategies : [new OpenLayers.Strategy.Fixed()],
styleMap : new OpenLayers.StyleMap({
'default' : style
}),
protocol : new OpenLayers.Protocol.HTTP({
url : "../data/c14_region.json",
format : new OpenLayers.Format.GeoJSON()
})

});

// layerの追加
map.addLayers([osmLayer, vecLayer]);

map.setCenter(new OpenLayers.LonLat(139.4, 35.4).transform(
epsg4326, epsg3857), 9);

// create map panel
mapPanel = new GeoExt.MapPanel({
title : "Map OpenStreetMapとGeoJSONデータ",
region : "center",
height : 400,
width : 500,
map : map,
// center: new OpenLayers.LonLat(139.4, 35.4),
zoom : 9
});

// create feature store, binding it to the vector layer
datastore = new GeoExt.data.FeatureStore({
layer : vecLayer,
fields : [{
name : 'name',
type : 'string'
}, {
name : 'code',
type : 'integer'
}],
autoLoad : true
});

// create grid panel configured with feature store
gridPanel = new Ext.grid.GridPanel({
title : "Feature Grid",
region : "east",
store : datastore,
width : 270,
columns : [{
header : "市区町村名",
width : 150,
dataIndex : "name",
sortable: true
}, {
header : "行政コード",
width : 100,
dataIndex : "code",
sortable: true
}],
sm : new GeoExt.grid.FeatureSelectionModel()
});

// create a panel and add the map panel and grid panel
// inside it
mainPanel = new Ext.Panel({
renderTo : "mainpanel",
layout : "border",
height : 400,
width : 770,
items : [mapPanel, gridPanel]
});

// マウス座標の緯度経度変換
function formatLonlats(lonLat) {
var lat = lonLat.lat;
var long = lonLat.lon;
var ns = OpenLayers.Util.getFormattedLonLat(lat);
var ew = OpenLayers.Util.getFormattedLonLat(long, 'lon');
return ns + ', ' + ew + ' ('
+ (Math.round(lat * 100000) / 100000) + ', '
+ (Math.round(long * 100000) / 100000) + ')';
}

});
Ext.onReady(function(){….}はExtJSのお約束です。
このExtJSについては、各人でお勉強しといてくださいね。
OpenStreetMapを表示するサンプルに、gridが付け加わったようになっていますし、columnの設定などもsourceから理解できると思います。
な感じです。
属性値をクリックするとそれに対応したfeatureが選択状態となり、逆にmap上にfeatureをクリックするとgridのデータに移動します。
これは、なかなか良いですね。
girdサンプルをクリックすると今回の地図が表示されます。
LayerSwitcherとOverviewMapのiconがなぜか表示されません。
mouseをicon近くに持って行くとmouse cursorが変わるので、クリックすると表示されます。
なぜだろう?
この現象は、OpenLayers-2.11では、iconのlink先がおかしいのか「四角い枠」だけ表示されます。
今回のまとめ
属性値をgridpanelに表示してみました。
これを使えば、いろいろなデータを重ね合わせて、属性値を表示するとができます。
次回は、viewportのlayoutを変更して、zoomsliderを付け加えてみます。 その後にtree.htmlを参考にして、OpenStreetMapと電子国土とGeoJSONデータの表示のtryします。


最近のコメント