GeoExt1.1で印刷してみる。応用編[Chapter 13]
いよいよ印刷に関して最後の章となりました。応用編とはいいながら、なんとなく実践編と変わらないんですけどね。
それでは、GeoExt1.1で印刷してみる。実践編[Chapter 12] に引き続き、印刷機能を追加していきます。
[Chapter 11] でGeoExtでprintを行うために、GeoServerをInstallして、print moduleを追加して、GeoServerがserviceを開始した状態で作業を進めます。
今回はPDFへ出力、印刷範囲の選択、OpenStreetMapの印刷を作成します。
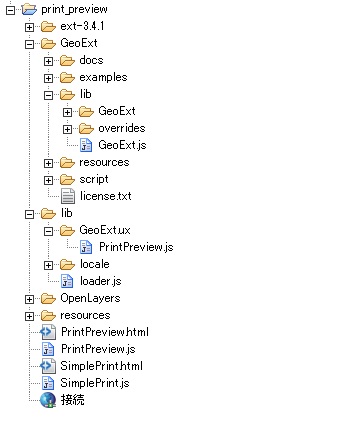
JavaScriptの構成
な感じです。
ここで、lib folderは、SimplePrint/libを利用しました。また、resources folderはPrintPreview/resourcesを利用しました。
その他は、GeoExt Tutorialで利用するExtJS-3.4.1,GeoExt1.1,OpenLayers-2.12を利用します。
Print Extent
まずは、Browserに表示したmapに印刷範囲を表示してみましょう。
htmlとjsに分けて記述していきます。
まずは、htmlファイルです。
ファイ名は、print-extent.html
[html]
<!DOCTYPE HTML>
<html lang="ja">
<head>
<meta http-equiv="content-type" content="text/html;charset=utf-8">
<title>GeoExt PrintExtent Example</title>
<script type="text/javascript" src="ext-3.4.1/adapter/ext/ext-base.js"></script>
<script type="text/javascript" src="ext-3.4.1/ext-all.js"></script>
<link rel="stylesheet" type="text/css" href="ext-3.4.1/resources/css/ext-all.css" />
<link rel="stylesheet" type="text/css" href="ext-3.4.1/examples/shared/examples.css" />
<script src="OpenLayers/OpenLayers.js"></script>
<script type="text/javascript" src="GeoExt/lib/GeoExt.js"></script>
<script type="text/javascript" src="print-extent.js"></script>
<!– The script below will load the capabilities of the print service
and save them into the global printCapabilities variable. Instead
of this, the PrintProvider can be configured with a url and take
care of fetching the capabilities. –>
<script type="text/javascript" src="http://localhost:8080/geoserver/pdf/info.json?var=printCapabilities"></script>
</head>
<body>
<h1>Setting the Print Extent on the Map Interactively</h1>
<p>
This example shows how to set the bounds of a printable PDF
interactively with a dynamic print extent rectangle.
<br>
It requires the <a href="http://trac.mapfish.org/trac/mapfish/wiki/PrintModuleInstallation">MapFish</a>
or <a href="http://docs.geoserver.org/stable/en/user/community/printing/">GeoServer</a>
print module.
</p>
<p>
Drag one of the handles to control the scale.
<br>
Grab one of the corner handles at its edge to rotate the extent.
<br>
Hold the SHIFT key to rotate in 45° increments only.
<br>
Drag the extent rectangle to change the center.
</p>
<p>
The js is not minified so it is readable.
<br>
See <a href="print-extent.js">print-extent.js</a>.
</p>
<div id="content"></div>
</body>
</html>
[/html]
このHTMLの
<script type="text/javascript" src="http://localhost:8080/geoserver/pdf/info.json?var=printCapabilities"></script>
で、localhostにinstallしたGeoServerのpdfを使うようにします。これは、印刷を行うための必須項目です。
次に、print-extent.jsです。
表示するMap dataはMapServerのWMSを利用します。
[javascript]
var mapPanel, printProvider;
var prefLayer, regionLayer, roadLayers;
Ext.onReady(function() {
// The printProvider that connects us to the print service
printProvider = new GeoExt.data.PrintProvider({
method : "GET", // "POST" recommended for production use
capabilities : printCapabilities, // from the info.json script
// in the html
customParams : {
mapTitle : "Printing Demo",
comment : "This is a map printed from GeoExt."
}
});
var printExtent = new GeoExt.plugins.PrintExtent({
printProvider : printProvider
});
// mapの作成
var map = new OpenLayers.Map({});
// Base Layer
prefLayer = new OpenLayers.Layer.WMS("神奈川県",
"http://localhost/cgi-bin/mapserv.exe", {
map : "c:/ms4w/Apache/htdocs/mapserver/example/kanagawa_wms.map",
layers : "kanagawa",
format : "image/png",
transparent : true
}, {
buffer : 0,
isBaseLayer : true,
// exclude this layer from layer container nodes
displayInLayerSwitcher : false
});
//
regionLayer = new OpenLayers.Layer.WMS("市区町村界",
"http://localhost/cgi-bin/mapserv.exe", {
map : "c:/ms4w/Apache/htdocs/mapserver/example/kanagawa_wms.map",
layers : "region",
format : "image/png",
transparent : true
}, {
buffer : 0,
isBaseLayer : false
// true
});
roadLayer = new OpenLayers.Layer.WMS("主要道路",
"http://localhost/cgi-bin/mapserv.exe", {
map : "c:/ms4w/Apache/htdocs/mapserver/example/kanagawa_wms.map",
layers : "road",
format : "image/png",
transparent : true
}, {
buffer : 0,
isBaseLayer : false
});
// layerの追加
map.addLayers([prefLayer, regionLayer, roadLayer]);
// map center
var lonlat = new OpenLayers.LonLat(139.35, 35.40);
map.setCenter(lonlat, 10);
// controlの追加
map.addControl(new OpenLayers.Control.ScaleLine());
map.addControl(new OpenLayers.Control.LayerSwitcher());
map.addControl(new OpenLayers.Control.MousePosition());
// The map we want to print, with the PrintExtent added as item.
mapPanel = new GeoExt.MapPanel({
renderTo : "content",
width : 600,
height : 480,
layers : [prefLayer, regionLayer, roadLayer],
center : [139.5, 35.5],
zoom : 8,
map : map,
plugins : [printExtent],
bbar : [{
text : "Create PDF",
handler : function() {
// the PrintExtent plugin is the mapPanel's 1st
// plugin
mapPanel.plugins[0].print();
}
}]
});
printExtent.addPage();
});
[/javascript]
このjs codeは簡単な説明を
-
printProviderの作成 info.jsonからcapabilities : printCapabilitiesを取得
-
printProviderからprintPageを作成
-
GeoExt.plugins.PrintExtentでprintExtentを作成
-
mapを作成して、Layerを定義(神奈川県の市町村界と道路)
-
mapPanelを作成
-
toolbar bottomにCreate PDFメニューを作成
-
print button click時のhandler : function(){…}を作成
-
mapPanelをbrowserに表示
Ext.onReady(function(){….}はExtJSのお約束です。
このExtJSについては、各人でお勉強しといてくださいね。
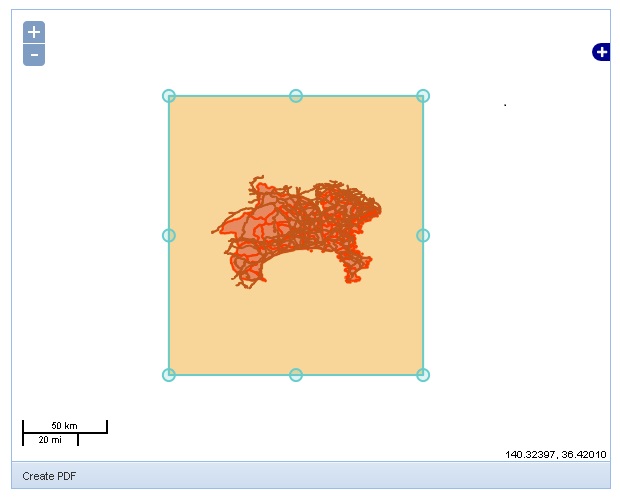
な感じで神奈川県全域と印刷範囲(print extent)が表示されます。
次に、印刷範囲(print extent)をdrag and dropすると、
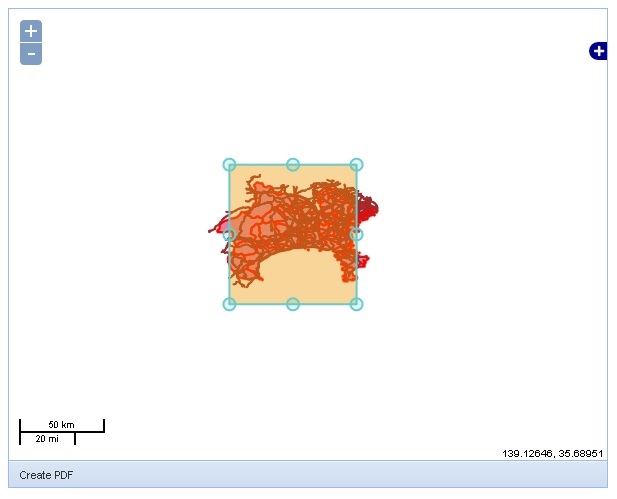
な感じで、印刷範囲を変更することができます。
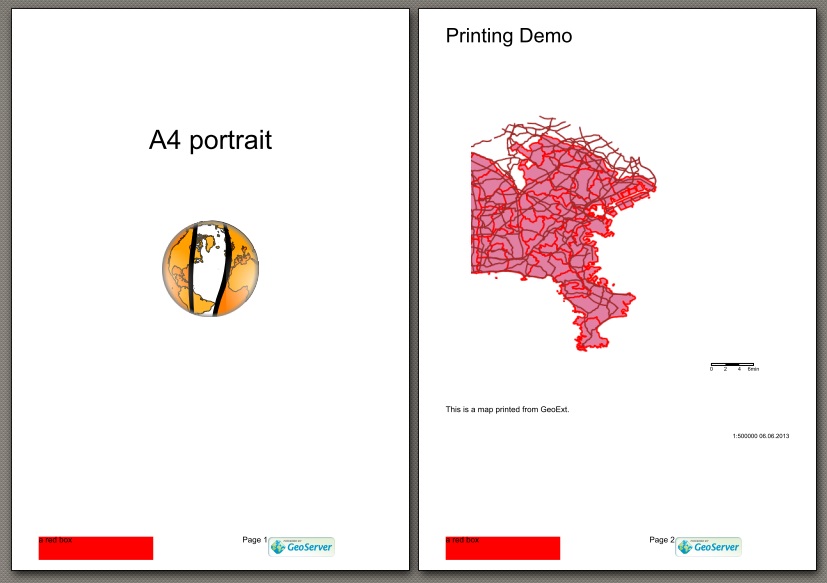
Create PDFで出力確認のDialogが表示されます。
な感じで設定した印刷範囲で印刷ができています。
とりあえずは、PDF Fileへの出力は確認できました。
OpenStreetMap PrintPreview
次に、OpenStreetMapのPreview windowを表示してみましょう。
htmlとjsに分けて記述していきます。
まずは、htmlファイルです。
ファイ名は、print-preview-osm.html
[html]
<!DOCTYPE HTML>
<html lang="ja">
<head>
<meta http-equiv="content-type" content="text/html;charset=utf-8">
<title>GeoExt PrintMapPanel Example</title>
<script type="text/javascript" src="ext-3.4.1/adapter/ext/ext-base.js"></script>
<script type="text/javascript" src="ext-3.4.1/ext-all.js"></script>
<link rel="stylesheet" type="text/css" href="ext-3.4.1/resources/css/ext-all.css" />
<link rel="stylesheet" type="text/css" href="ext-3.4.1/examples/shared/examples.css" />
<script src="OpenLayers/OpenLayers.js"></script>
<script type="text/javascript" src="GeoExt/lib/GeoExt.js"></script>
<script type="text/javascript" src="print-preview-osm.js"></script>
<!– The script below will load the capabilities of the print service
and save them into the global printCapabilities variable. Instead
of this, the PrintProvider can be configured with a url and take
care of fetching the capabilities. –>
<script type="text/javascript" src="http://localhost:8080/geoserver/pdf/info.json?var=printCapabilities"></script>
</head>
<body>
<h1>Using a Print Preview</h1>
<p>
This example shows the how to use GeoExt.PrintMapPanel, to create
a printable OSM map. It requires the
<a href="http://trac.mapfish.org/trac/mapfish/wiki/PrintModuleInstallation">MapFish</a>
or <a href="http://docs.geoserver.org/stable/en/user/community/printing/">GeoServer</a>
print module.
</p>
<p>
The js is not minified so it is readable. See <a href="print-preview-osm.js">print-preview-osm.js</a>.
</p>
<div id="content"></div>
</body>
</html>
[/html]
このHTMLの
<script type="text/javascript" src="http://localhost:8080/geoserver/pdf/info.json?var=printCapabilities"></script>
で、localhostにinstallしたGeoServerのpdfを使うようにします。これは、印刷を行うための必須項目です。
次に、print-preview-osm.jsを見てみると、
[javascript]
var mapPanel, printDialog;
Ext.onReady(function() {
// The PrintProvider that connects us to the print service
var printProvider = new GeoExt.data.PrintProvider({
method : "GET", // "POST" recommended for production use
capabilities : printCapabilities, // provide url instead for lazy
// loading
customParams : {
mapTitle : "GeoExt Printing Demo",
comment : "This demo shows how to use GeoExt.PrintMapPanel with OSM"
}
});
// A MapPanel with a "Print…" button
mapPanel = new GeoExt.MapPanel({
renderTo : "content",
width : 500,
height : 350,
map : {
maxExtent : new OpenLayers.Bounds(-128 * 156543.0339, -128
* 156543.0339, 128 * 156543.0339, 128 * 156543.0339),
maxResolution : 156543.0339,
units : "m",
projection : "EPSG:3857"
},
layers : [new OpenLayers.Layer.OSM()],
/*
* layers: [new OpenLayers.Layer.WMS("Tasmania State Boundaries",
* "http://demo.opengeo.org/geoserver/wms", {layers:
* "topp:tasmania_state_boundaries"}, {singleTile: true})],
*/
center : [16314984.568391, -5095295.7603428],
zoom : 6,
bbar : [{
text : "Print...",
handler : function() {
// A window with the PrintMapPanel, which we can use to adjust
// the print extent before creating the pdf.
printDialog = new Ext.Window({
title : "Print Preview",
width : 350,
autoHeight : true,
items : [{
xtype : "gx_printmappanel",
// use only a PanPanel control
map : {
controls : [new OpenLayers.Control.PanPanel()]
},
sourceMap : mapPanel,
printProvider : printProvider
}],
bbar : [{
text : "Create PDF",
handler : function() {
printDialog.items.get(0).print();
}
}]
});
printDialog.show();
}
}]
});
});
[/javascript]
このjs codeは簡単な説明を
-
mapを作成して、Layerを定義(神奈川県の市町村界と道路)
-
mapPanelを作成
-
toolbar bottomにprintメニューを作成
-
print button click時のhandler : function(){…}を作成
-
Ext.WindowからprintDialogを作成
-
div = 'content'にmapPanelをrender
mapPanel内のhandler : function() {…}でprint buttonがclickされた時にprintDialogして、previewを表示します。
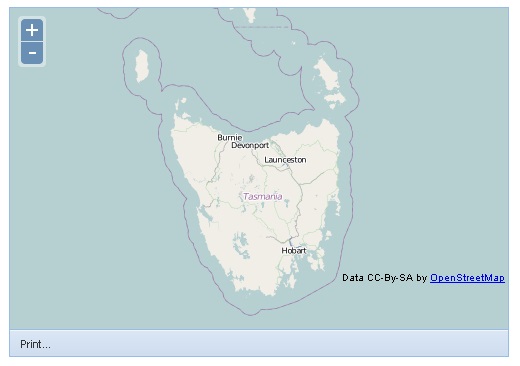
な感じでOpenStreetMapが表示されます。
次に、toolbar bottomのprint buttonをclickすると、
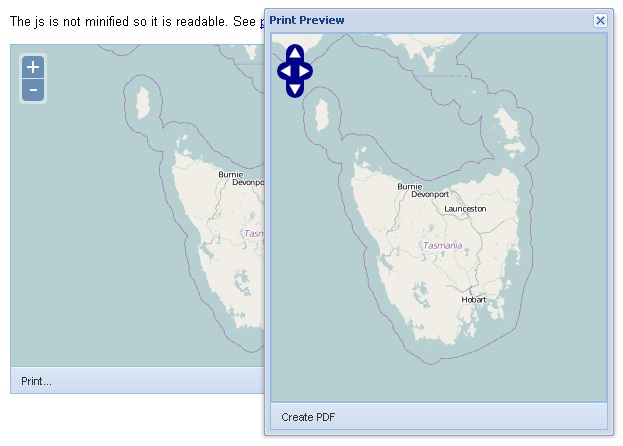
な感じで、printDialog windowが開いてOpenStreetMapの印刷画面が表示されます。Create PDF buttonをclickするとPDF Fileに出力されます。
今回のまとめ
GeoExtのprint機能の基本+応用を利用しました。
今回のOpenStreetMapはGeoExtのsampleとしてdefaultでタスマニアを表示していますが、いままでのTutorialを参考に自分の好きな地点が表示のdefaultになるようにtryしてください。また、あわせて電子国土の印刷を追加もtryしてください。
まだまだGeoExtについては多くの機能があるのですが、とりあえずはTutorialはここまでとします。
以降は、GeoExt APIについて学んでいきます。

最近のコメント